Financial Highlights
(Dollars in millions except per share data) |
2013 |
2012 |
Change |
||||
Revenues |
$ |
12,104 |
$ |
12,237 |
(1)% |
||
International revenues % |
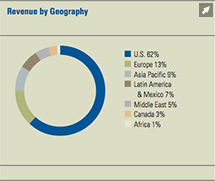
38% |
38% |
|||||
Segment profit1 |
$ |
963 |
$ |
1,132 |
(15)% |
||
Income from continuing operations |
$ |
498 |
$ |
581 |
(14)% |
||
Manufacturing group debt2 |
$ |
1,931 |
$ |
2,301 |
(16)% |
||
Shareholders’ equity |
$ |
4,348 |
$ |
2,991 |
47% |
||
Manufacturing group debt-to-capital (net of cash)2 |
15% |
24% |
|||||
Common Share Data |
|||||||
Diluted EPS from continuing operations |
$ |
1.75 |
$ |
1.97 |
11% |
||
Dividends per share |
$ |
0.08 |
$ |
0.08 |
–% |
||
Diluted average shares outstanding (in thousands) |
284,428 |
294,663 |
(3)% |
||||
Key Performance Metrics |
|||||||
ROIC3 |
13.0% |
17.5% |
|||||
Net cash provided by operating activities of continuing operations – Manufacturing group – GAAP2 |
$ |
658 |
$ |
958 |
(31)% |
||
Manufacturing cash flow before pension contributions – Non-GAAP2,4 |
$ |
256 |
$ |
793 |
(68)% |
||
Pension contributions |
$ |
204 |
$ |
405 |
(50)% |
||
Capital expenditures |
$ |
444 |
$ |
480 |
(8)% |
||
Net Debt |
|||||||
Finance group debt |
$ |
1,256 |
$ |
1,686 |
$ |
(430) |
|
Manufacturing group debt |
1,931 |
2,301 |
(370) |
||||
Total debt |
3,187 |
3,987 |
(800) |
||||
Consolidated cash and equivalents |
(1,211) |
(1,413) |
202 |
||||
Net debt |
$ |
1,976 |
$ |
2,574 |
$ |
(598) |
|
|
1 Segment profit for the manufacturing segments excludes interest expense and certain corporate expenses. The measurement for the Finance segment includes interest income and expense along with intercompany interest expense.
2 Our Manufacturing group includes all continuing operations of Textron Inc., except for the Finance segment.
3 Calculation of return on invested capital (“ROIC”) is provided on the RETURN ON INVESTED CAPITAL page.
4 Calculations of Manufacturing cash flow before pension contributions are provided on the SELECTED FINANCIAL STATISTICS page.
|
|||||||
(As of March 1, 2013) |
Senior Long-Term |
Short-Term Commercial Paper |
|||||
Textron Inc. Credit Ratings |
|||||||
S&P |
BBB- |
A3 |
|||||
Fitch |
BBB- |
F3 |
|||||
Moody’s |
Baa3 |
P3 |
|||||
COMMITMENT TO FUTURE GROWTH
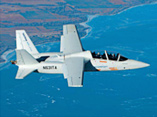
1. Scorpion Hybrid ISR/Strike Aircraft

2. Bad Boy Buggies Ambush iS

3. Mechtronix FFSX™

4. Beechcraft King Air 350i
- Investing for future growth, organically and through acquisitions, is a key focus for Textron. Here are a few illustrations of key examples from 2013. There are also many more examples contained within the Segment sections
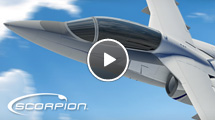
- 1. Textron AirLand, LLC, introduced the Scorpion tactical jet, a hybrid Intelligence, Surveillance and Reconnaissance (ISR)/Strike aircraft platform. The Scorpion successfully achieved first flight in less than 24 months.
- 2. Bad Boy Buggies introduced the Ambush iS, a new generation 4x4 Hybrid with switchable powertrains, and the ability to recharge its own batteries.
- 3. Textron Systems formed new Training & Simulation business by combining the two recent acquisitions of OPINICUS Corporation and Mechtronix, Inc. with its existing training and simulation business.
- 4. Announced our intent to acquire Beechcraft Corporation, which designs, builds and supports aircraft, including the King Air turboprops such as the one pictured. The transaction is expected to close during the first quarter of 2014, subject to closing conditions, including regulatory approvals.

