FINANCE
- 1
- %
- Finance’s share of
Textron 2013 revenues
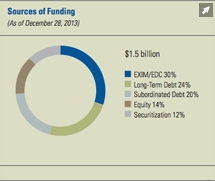
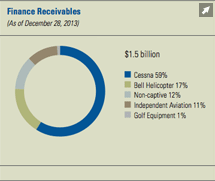
The Finance segment provides financing to customers purchasing products manufactured by Textron Inc. Textron Financial Corporation and its consolidated subsidiaries comprise the Finance Segment.
Key Data
(Dollars in millions) |
2013 |
2012 |
2011 |
2010 |
2009 |
||||||
Finance |
|||||||||||
Finance receivables held for investment1 |
$ |
1,438 |
$ |
1,934 |
$ |
2,477 |
$ |
4,213 |
$ |
6,206 |
|
Finance receivables held for sale1 |
$ |
65 |
$ |
140 |
$ |
418 |
$ |
413 |
$ |
819 |
|
Total finance receivables |
$ |
1,548 |
$ |
2,074 |
$ |
2,895 |
$ |
4,626 |
$ |
7,055 |
|
60 day + delinquency2 |
5.39% |
4.65% |
6.70% |
9.77% |
9.23% |
||||||
Nonaccrual %2 |
7.08% |
7.39% |
12.96% |
20.17% |
16.75% |
||||||
Debt to shareholder’s equity |
6.01x |
4.74x |
4.78x |
6.41x |
6.72x |
||||||
Revenues |
$ |
132 |
$ |
215 |
$ |
103 |
$ |
218 |
$ |
361 |
|
Segment (loss) profit3 |
$ |
49 |
$ |
64 |
$ |
(333) |
$ |
(237) |
$ |
(294) |
|
Total assets |
$ |
1,725 |
$ |
2,322 |
$ |
3,213 |
$ |
4,949 |
$ |
7,512 |
|
Dividends paid to Textron Inc. |
$ |
175 |
$ |
345 |
$ |
179 |
$ |
505 |
$ |
349 |
|
Capital contributions paid to Finance group |
$ |
1 |
$ |
240 |
$ |
182 |
$ |
383 |
$ |
270 |
|
|
1 In December 2008, Textron began a process to exit the non-captive portion of its finance business.
2 Improvement in delinquency statistics in 2011 was primarily due to the transfer of the remaining Golf Mortgage portfolio from held for investment to the held for sale classification, along with the resolution of several Timeshare accounts.
3 Segment (loss) profit represents the measurement used by Textron for evaluating performance and for decision-making purposes. Segment (loss) profit for the Finance segment includes interest income and expense along with inter-company interest expense. In 2011, segment (loss) profit includes a $186 million initial mark-to-market adjustment for remaining finance receivables in the Golf Mortgage portfolio that were transferred to the held for sale classification.
|
|||||||||||


